
The network security dashboard of a CSPM tool offers an overview of an organization’s cloud network infrastructure and its associated security posture. This dashboard focuses on monitoring and managing the security aspects of network configurations, traffic flows, and connectivity within the cloud environment. The following screenshot provides a glimpse of the network security dashboard of Microsoft Defender for Cloud:
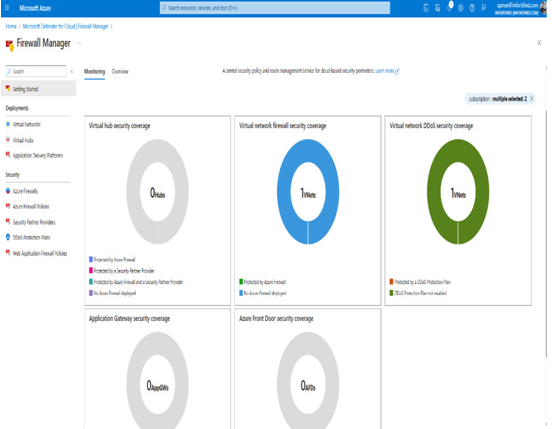
Figure 10.6 – Microsoft Defender for Cloud – the Firewall Manager dashboard (source: Microsoft Defender for Cloud CSPM dashboard)
Here is an explanation of the key components and functionalities of a network security dashboard:
- Network topology visualization: The dashboard provides a visual representation of the cloud network topology, including virtual networks (VNets), subnets, gateways, load balancers, and other network components. This helps administrators understand the layout of the network infrastructure.
- Security groups and firewall rules: It displays firewall rules and security group configurations that control inbound and outbound traffic to and from resources. Administrators can assess whether rules are properly configured and aligned with security policies.
- Virtual private cloud (VPC) configuration: For cloud providers that use the concept of a VPC (for example, AWS), the dashboard provides a comprehensive view of VPC configurations. It includes details such as IP address ranges, subnets, route tables, and internet gateways. Administrators can review and manage VPC settings to ensure secure network architecture.
- Network segmentation: The dashboard shows how resources are segmented within the network. This is crucial for isolating sensitive workloads and reducing the attack surface. If some critical component is missing, it also provides recommendations. For example, the dashboard can provide a list of Azure subnets that are not attached to a network security group (NSG) or VNet without an NSG. This helps you quickly find out the critical areas where immediate attention is required.
- Traffic flow analysis: It provides insights into network traffic patterns, showing the volume and types of traffic flowing between different resources. This helps with identifying anomalies and potential security threats.
- Security group analysis: The dashboard highlights security groups and their associated rules, helping administrators identify overly permissive rules or misconfigurations that might expose resources to risks.
- Access control lists (ACLs): It displays ACLs that control traffic at the subnet level, allowing administrators to verify that traffic between subnets is properly controlled.
- Network encryption: The dashboard might provide information about encryption protocols used for data in transit within the network, ensuring that sensitive data is adequately protected.
- Virtual private network (VPN) and peering connections: For hybrid cloud environments, the dashboard could show VPN and peering connections between on-premises infrastructure and the cloud.
- Public and private connectivity: It highlights public-facing and private-facing resources, helping administrators confirm that public resources are appropriately exposed and that private resources are not inadvertently accessible.
- Network anomalies: Dashboards also bring anomaly detection capabilities that flag unusual or unexpected network behavior, indicating potential security breaches or misconfigurations. Misconfigurations will be discussed separately in Chapter 11.
- Integration with threat intelligence: The dashboard may integrate with threat intelligence feeds to provide information about known malicious IP addresses or domains attempting to access resources. Threat intelligence tools such as Mandiant and CrowdStrike are integrated in many cases. Next-generation CSPM tools are also trying to bring threat intelligence feeds directly into the tool itself.
- Network compliance: It helps assess whether network configurations comply with industry standards, best practices, and regulatory requirements.
- Alerts and notifications: The dashboard can generate alerts and notifications for security incidents, policy violations, or suspicious network activities.
- Integration with remediation: Some tools are also equipped with remediation capabilities. The dashboard might allow administrators to take immediate action to modify firewall rules, adjust security group settings, or isolate compromised resources. This may require additional permissions from the tools so that you can make changes to your cloud environment.
- Historical network data: The dashboard might display historical network data and trends to help administrators understand changes and improvements over time.
- User access control: Just like other dashboards, the network security dashboard supports RBAC to ensure that only authorized individuals can view and manage network-related configurations.
The network security dashboard in a CSPM tool focuses on visualizing and managing the security aspects of an organization’s cloud network infrastructure. By providing insights into network configurations, traffic flows, and connectivity, administrators can identify vulnerabilities, misconfigurations, and potential security risks, allowing them to take proactive measures to maintain a secure cloud environment. Now, let’s look at another important dashboard.